About Us
About the Doctor
Location
About Applied Kinesiology
Bulletin Board
Wellness Library
Subluxation Explained
Degeneration
Nerve Chart
Chiropractic Slide Show
Ask the Experts
Kids & Chiropractic
Linked Health Articles
Understanding a Nerve Chart: A Guide to the Human Nervous System
A nerve chart is a visual representation of the human nervous system that shows the pathways and distribution of nerves throughout the body. It serves as an important educational and diagnostic tool used by healthcare professionals, students, therapists, and patients to understand how nerves connect different parts of the body to the brain and spinal cord. By mapping the complex network of nerves, a nerve chart helps explain how sensations, movements, and bodily functions are controlled and coordinated.
The human nervous system is one of the most complex systems in the body. It consists of billions of nerve cells that transmit signals between the brain, spinal cord, and every organ, muscle, and tissue. A nerve chart simplifies this complexity by illustrating the major nerves and their corresponding areas of influence. These charts are commonly found in medical offices, educational institutions, physical therapy clinics, and chiropractic practices.
What Is the Nervous System?
To understand a nerve chart, it is important first to understand the nervous system itself. The nervous system is responsible for receiving information, processing it, and generating responses. It controls everything from voluntary movements such as walking and speaking to involuntary functions such as breathing, digestion, and heart rate.
The nervous system is divided into two main components:
Central Nervous System (CNS)
The central nervous system consists of the brain and spinal cord. It acts as the body’s control center, receiving information from the body and sending instructions back through the nerves.
Peripheral Nervous System (PNS)
The peripheral nervous system includes all nerves outside the brain and spinal cord. These nerves connect the central nervous system to the rest of the body, including muscles, skin, organs, and glands.
A nerve chart often highlights both systems and shows how they interact to maintain bodily functions.
Components Displayed on a Nerve Chart
A detailed nerve chart typically includes several important anatomical structures.
Brain
The brain is usually displayed at the top of the chart because it serves as the primary control center of the nervous system. It processes sensory information, regulates body functions, and controls thoughts, emotions, and movements.
Spinal Cord
The spinal cord extends from the brainstem down through the vertebral column. It acts as a communication highway, carrying messages between the brain and the rest of the body. A nerve chart often emphasizes the spinal cord because many nerves branch directly from it.
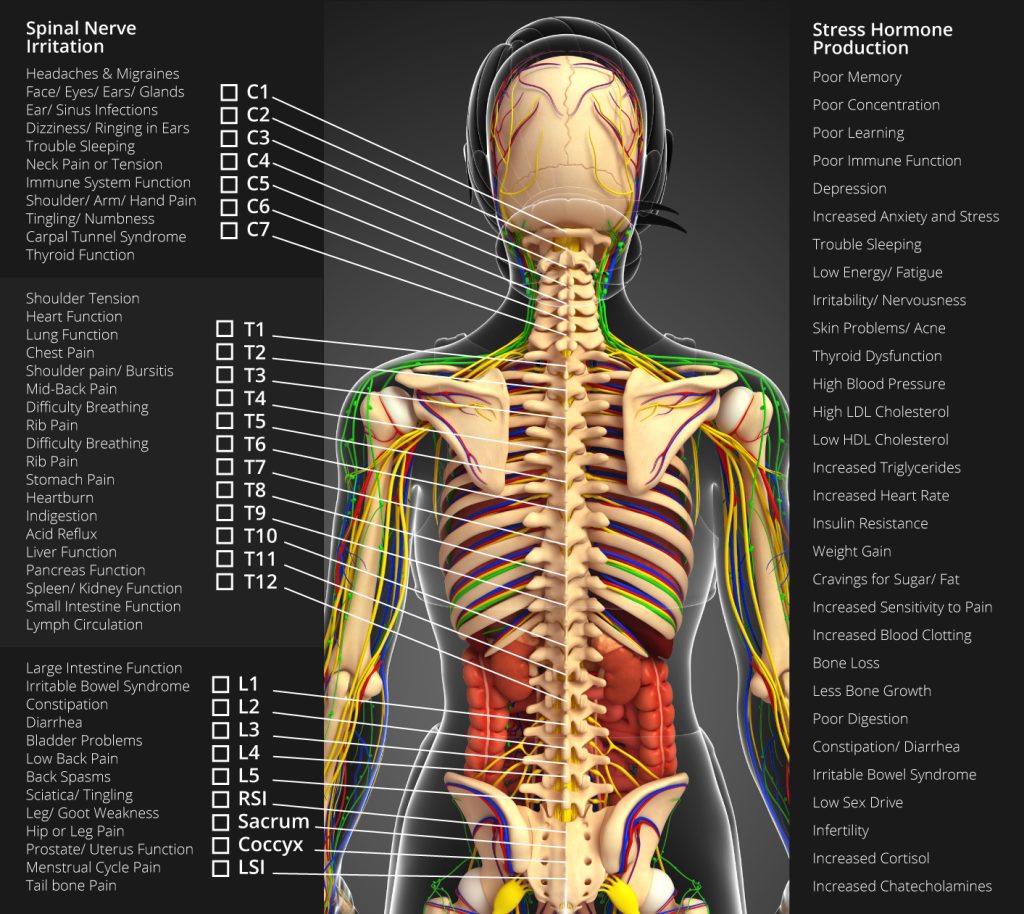
Spinal Nerves
Thirty-one pairs of spinal nerves emerge from the spinal cord. These nerves are commonly categorized into regions:
- 8 Cervical nerves (neck)
- 12 Thoracic nerves (upper back)
- 5 Lumbar nerves (lower back)
- 5 Sacral nerves (pelvic region)
- 1 Coccygeal nerve (tailbone area)
A nerve chart shows how each spinal nerve supplies specific areas of the body.
Peripheral Nerves
Peripheral nerves extend throughout the body and carry sensory and motor signals. Major peripheral nerves often illustrated include:
- Median nerve
- Ulnar nerve
- Radial nerve
- Sciatic nerve
- Femoral nerve
- Tibial nerve
These nerves are responsible for movement, sensation, and communication between the brain and body.
Purpose of a Nerve Chart
Nerve charts serve several important purposes in healthcare and education.
Educational Tool
Students studying anatomy, physiology, nursing, physical therapy, or medicine use nerve charts to learn the organization of the nervous system. Visual representations help learners understand how nerves travel throughout the body and interact with organs and muscles.
Diagnostic Reference
Healthcare providers use nerve charts to identify possible nerve-related conditions. When a patient experiences symptoms such as numbness, tingling, weakness, or pain, a nerve chart can help determine which nerve may be involved.
Patient Education
Doctors and therapists frequently use nerve charts to explain medical conditions to patients. Visual aids make it easier for individuals to understand their diagnosis and treatment plan.
Understanding Dermatomes on a Nerve Chart
Many nerve charts include dermatomes, which are specific areas of skin supplied by individual spinal nerves. Each spinal nerve corresponds to a particular region of the body.
For example:
- Cervical nerves supply the neck, shoulders, arms, and hands.
- Thoracic nerves supply the chest and upper abdomen.
- Lumbar nerves supply parts of the lower back and legs.
- Sacral nerves supply the buttocks, pelvic area, and feet.
When nerve damage occurs, symptoms often appear within the dermatome served by the affected nerve. This information helps healthcare providers locate the source of nerve problems.
Myotomes and Muscle Function
In addition to dermatomes, some nerve charts include myotomes. A myotome refers to a group of muscles controlled by a particular spinal nerve root.
Examples include:
- C5 nerve root assists shoulder movement.
- C6 nerve root contributes to wrist extension.
- L4 nerve root supports knee extension.
- S1 nerve root contributes to ankle movement.
Testing muscle strength in these areas helps identify nerve root injuries and neurological disorders.
Common Conditions Referenced Using Nerve Charts
Several medical conditions can be better understood through the use of nerve charts.
Sciatica
Sciatica occurs when the sciatic nerve becomes compressed or irritated. Symptoms often include pain, numbness, or tingling that radiates from the lower back down the leg. A nerve chart clearly shows the path of the sciatic nerve, helping explain symptom patterns.
Herniated Disc
A herniated spinal disc can compress nearby nerves. Depending on the location of the compression, symptoms may affect specific dermatomes or myotomes shown on a nerve chart.
Peripheral Neuropathy
Peripheral neuropathy involves damage to peripheral nerves and may cause numbness, burning sensations, weakness, or pain. Nerve charts help illustrate which nerves may be affected.
Carpal Tunnel Syndrome
This condition occurs when the median nerve is compressed at the wrist. A nerve chart can demonstrate how symptoms such as numbness in the thumb, index finger, and middle finger relate to median nerve function.
Importance in Physical Therapy and Rehabilitation
Physical therapists often use nerve charts when evaluating patients recovering from injuries or neurological disorders. Understanding nerve pathways helps therapists design rehabilitation programs that target affected muscles and improve nerve function.
For example, if a patient experiences weakness in a specific muscle group, a therapist may refer to a nerve chart to identify the responsible nerve and develop exercises that support recovery.
Modern Applications of Nerve Mapping
Advancements in medical technology have expanded the use of nerve mapping beyond traditional charts. Digital imaging, magnetic resonance imaging (MRI), nerve conduction studies, and electromyography (EMG) allow healthcare professionals to assess nerve function with greater precision.
However, traditional nerve charts remain valuable because they provide a clear and easy-to-understand overview of nervous system anatomy.
Conclusion
A nerve chart is an essential visual tool that illustrates the structure and function of the human nervous system. It shows how nerves connect the brain and spinal cord to every part of the body, allowing communication, movement, and sensation. By displaying spinal nerves, peripheral nerves, dermatomes, and myotomes, nerve charts help students learn anatomy, assist healthcare professionals in diagnosis, and educate patients about their conditions. Whether used in medical education, rehabilitation, or clinical practice, nerve charts continue to play a vital role in understanding the intricate network that keeps the human body functioning properly.